Automated Lung Ultrasound
A-lines and B-lines are the fastest bedside read on a sick lung, but a ward short on trained sonographers cannot always find someone to read them. Six systems built together teach a machine to do that reading instead: spot the landmarks, segment the lines, score severity, and hand back only the frames that matter.
14MB network
A- and B-lines
landmark detection
summarization
A-lines and B-lines take a trained eye to read
Point-of-care ultrasound is cheap and radiation-free. Reading it consistently is not.
A healthy lung reflects almost all of an ultrasound pulse back and forth between the pleura and the transducer, producing the horizontal reverberation lines called A-lines. Fluid in the lung breaks that reflection and lets the pulse propagate past the pleura, producing vertical B-lines instead. Counting these two patterns is how a clinician grades lung involvement in COVID-19, pulmonary edema and other interstitial disease, at the bedside, without radiation.
The bottleneck is not the scanner, it is the reader. Ultrasound interpretation is operator-dependent, and the hospitals seeing the most patients during a respiratory surge are often the ones with the fewest sonographers on shift. An automated pipeline has to do four things a clinician does by eye: find the landmarks, segment the lines, score severity, and surface only the frames worth a second look.
Finding pleura, A-lines and B-lines two different ways
A fast supervised detector for real-time use, and an unsupervised one for when there are no labels to train on.
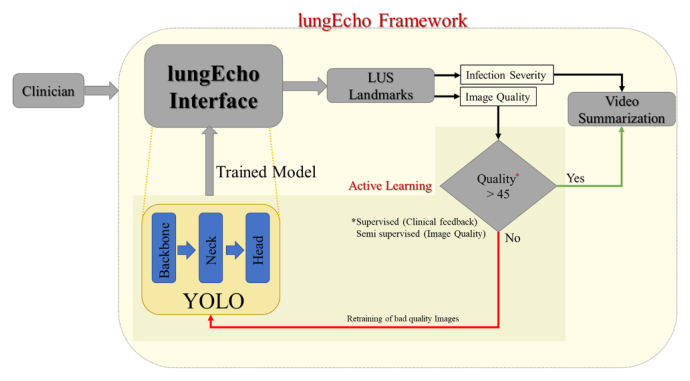
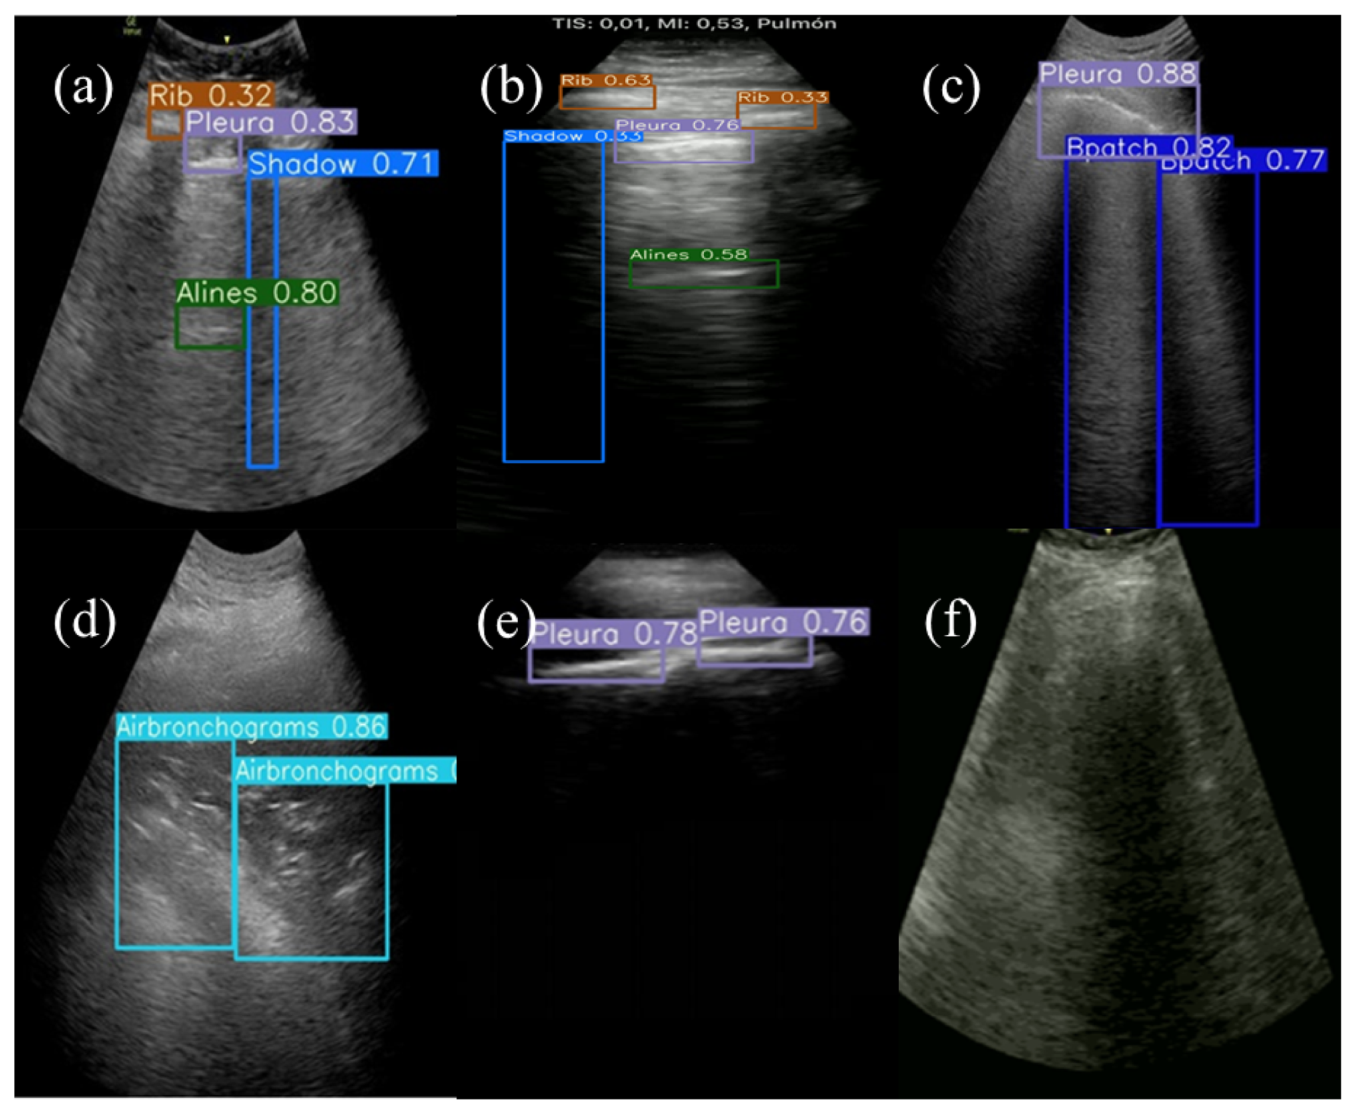
lungEcho runs a 14MB YOLOv5s network trained to find eight things in a frame: pleura, rib, shadow, A-lines, B-lines, B-patches, consolidations and air bronchograms. On a Quadro P4000 it processes a frame in 8.1ms, fast enough for live video at 123fps, and reaches a mean average precision of 66% at an IoU of 0.5, the best of four single-stage detectors tested and the smallest by a wide margin.
| Detector | Backbone | mAP@0.5 | FPS | Size |
|---|---|---|---|---|
| YOLOv5s | CSPDarknet | 0.660 | 123 | 14 MB |
| SSD | VGG-16 | 0.630 | 31 | 96 MB |
| RetinaNet | ResNet-50 | 0.529 | 4 | 92 MB |
| EfficientDet | EfficientNet | 0.357 | 17 | 17 MB |
83 held-out test images, 416×416 input (300×300 for SSD), single Quadro P4000 GPU.
When there is no labelled data to start from, an unsupervised transporter network can still find the same landmarks. It learns keypoints by comparing pairs of frames and transporting features from one to the other, but a generic transporter has no reason to land on anything clinically relevant. This version constrains it first: a distance-gain mask suppresses shallow fat and muscle reflections, and a Radon transform isolates horizontal features (pleura, A-lines) from vertical ones (B-lines) before the keypoints are computed. Validated on 230 videos from 40 subjects across two countries, the resulting keypoints reach 99% sensitivity against expert-marked landmarks, and classify a frame as normal or abnormal with 97% accuracy and no supervised training at all.
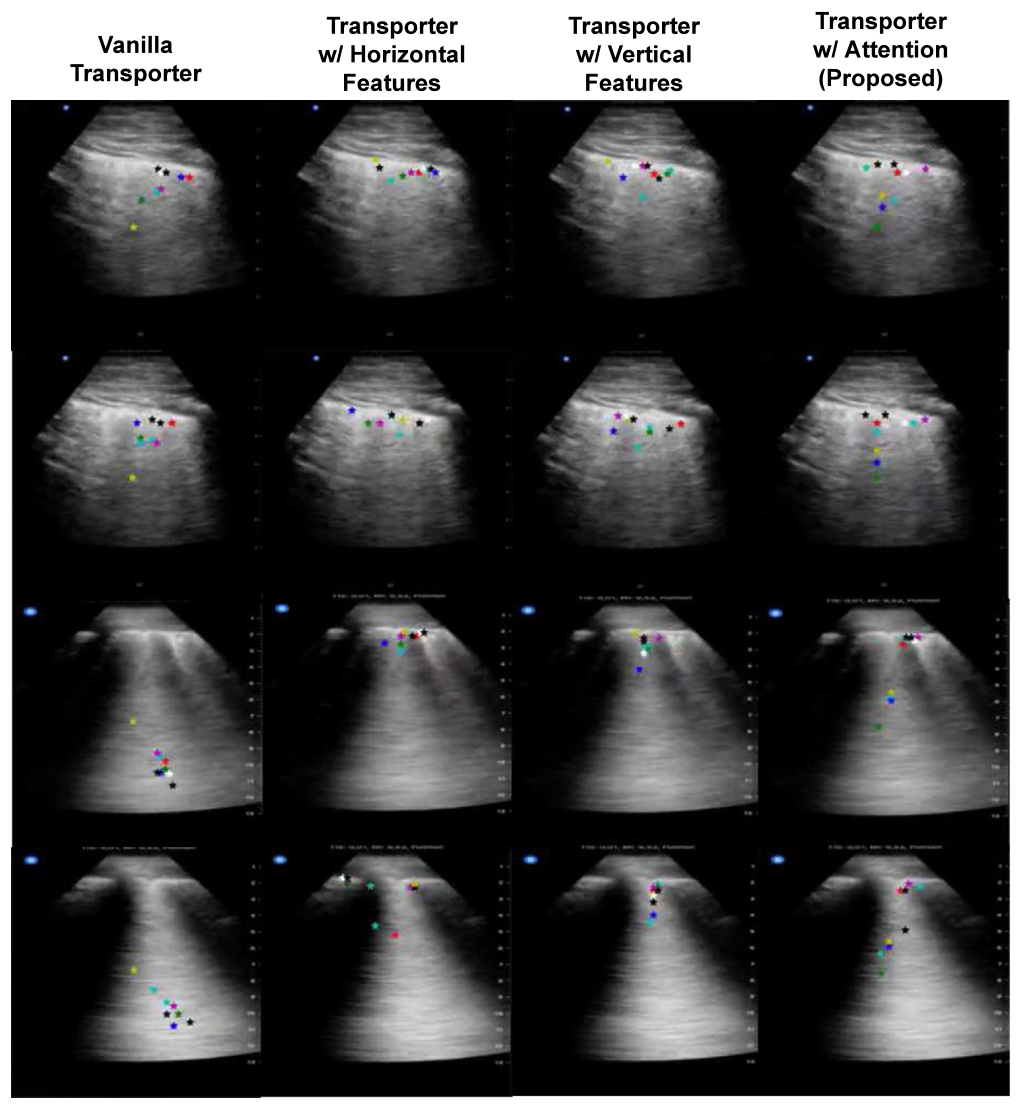
A loss function built for blurred boundaries
Counting A-lines and B-lines needs a clean edge, not just an accurate mask.
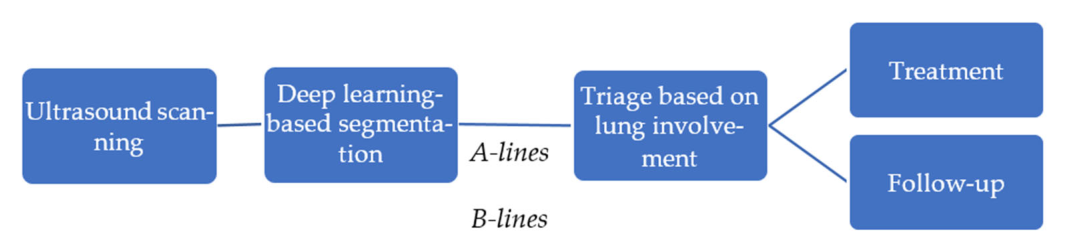
TransBound-UNet segments A-lines and B-lines with a Vision Transformer encoder (ViT-MSN-Small, pretrained with Masked Siamese Networks) and a lightweight convolutional decoder. Its loss function adds a boundary-weighted penalty on top of Dice loss, pushing the network harder on the pixels right at a line’s edge, which is exactly where A-lines and B-lines blur together.
Trained and 5-fold cross-validated on 4,599 labelled frames, it reaches a Dice score of 0.80 and a Hausdorff Distance of 15.13, more than halving the boundary error of every other network tested, while running lighter: dropping skip connections and simplifying the decoder cuts FLOPs from 27.06 to 4.57 GFLOPs and parameters from 63M to 23M against the original TransUNet.
| Metric | TransBound-UNet | TransUNet | Lightweight U-Net |
|---|---|---|---|
| Dice Score ↑ | 0.80 | 0.75 | 0.745 |
| Specificity ↑ | 0.97 | 0.96 | 0.95 |
| Precision ↑ | 0.85 | 0.81 | 0.75 |
| Hausdorff Distance ↓ | 15.13 | 34.52 | 38.96 |
Turning frames into a severity score and a highlight reel
Every frame gets a quality score and a severity class; every video gets compressed to the moments that matter.
Detected landmarks feed two scores directly. A quality score weighs pleura (30 points), rib and shadow (15 and 10) and any artefact (45), so a frame needs pleura plus at least one artefact to reach “excellent”. This flags unreadable frames with 97.7% accuracy (95% sensitivity, 97% specificity) and routes them back for retraining. A severity score of 0 to 4 tracks the same progression clinicians use, A-lines through B-lines to consolidation with air bronchograms, and the worst frame in a video sets that video’s score. Across 127 videos this calls a video normal or abnormal with 90.8% accuracy and an AUC of 0.89, rolling the result into a 14-point colour-coded scan map a clinician can read at a glance.
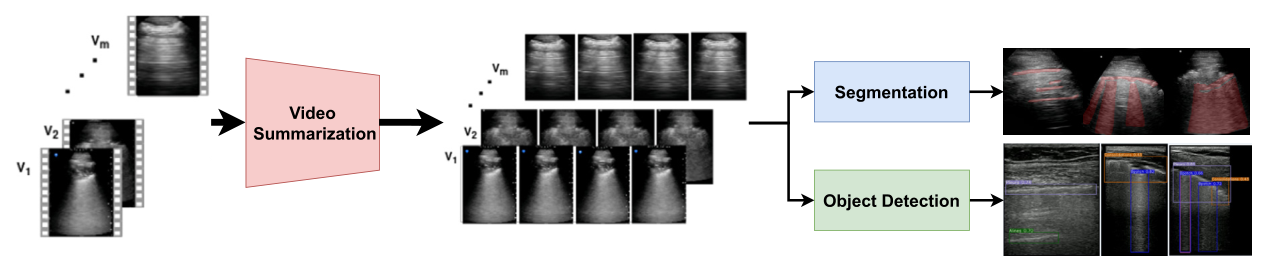
For messier, unlabelled footage, a second summarizer built on reinforcement learning does the compressing instead. Three independently-trained encoders, a healthy/unhealthy classifier, a pleura and A-/B-line segmenter, and a plain autoencoder, each read a frame differently; an attention layer fuses the three views, and a Bi-LSTM decoder scores every frame’s importance. It trains with no ground truth at all, rewarded instead for picking frames that are diverse, representative, structurally dissimilar from their neighbours, and biased toward the unhealthy sections clinicians actually want to see. Benchmarked against expert-annotated video from three geographies, it reaches 80% precision and a 44% F1 score while cutting video length by 77%, a quarter of the original size and bandwidth for telemedicine.
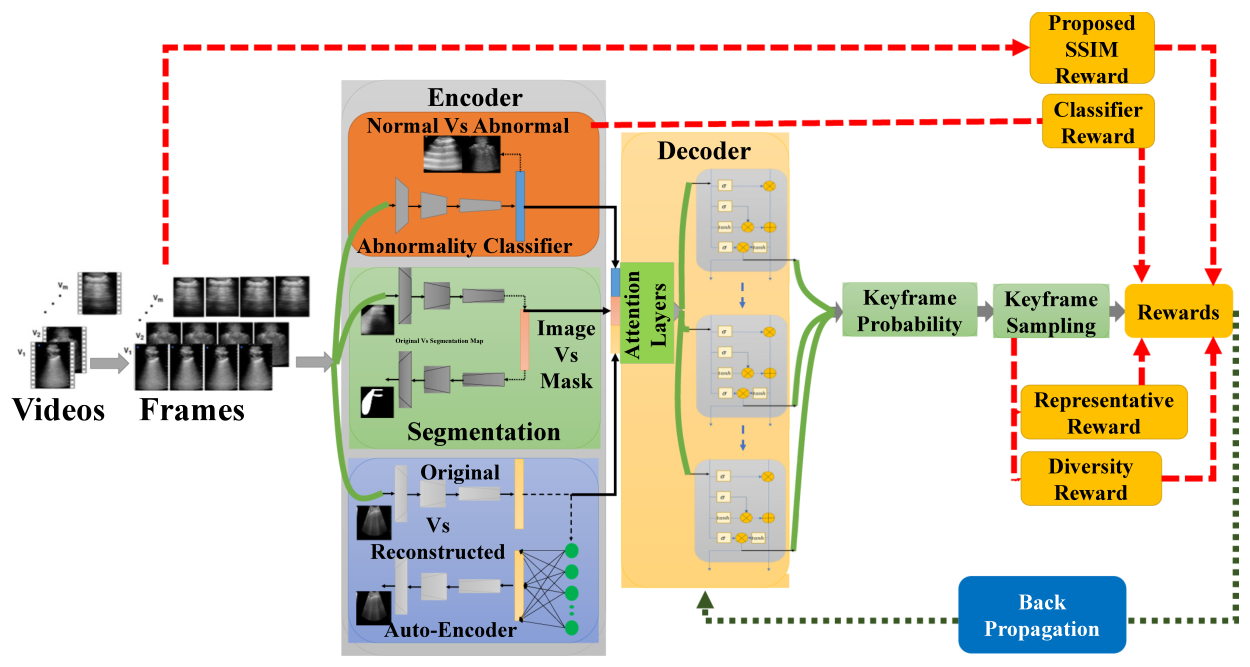
One open-source package, upload to report
SPAALUV wires video summarization, segmentation and landmark tagging into a single web app.
SPAALUV packages the pipeline as an open-source web application: a React front end talks to a FastAPI back end running the summarization, segmentation and YOLOv5 tagging models. A clinician uploads a video, the app summarizes it to its key frames, then segments and tags landmarks in those frames alone, with the pleura and abnormal regions highlighted and confidence scores shown on each box. Results, including the summarized video itself, download as a single zip file. The framework accepts new models by dropping in a weights folder and a short inference script, so it is not locked to lung ultrasound alone.