Aberration Correction
Every conventional beamformer assumes sound crosses the body at one fixed speed. A fat layer near the probe breaks that assumption, and the error compounds with depth. This project replaces the geometric delay with one marched through an actual speed-of-sound map.
conventional DAS assumes
across human tissues
twice the prior art
in the steepest fat case
The aberration bench
The four simulated media from the paper. Add a fat layer, tilt it, and watch where conventional delay-and-sum thinks the targets are. Then switch the beamformer.
Geometry after Figs. 1 and 3 of the paper; displacements are drawn to illustrate the failure mode, not to scale. The three readouts are the measured values from Table I for the selected medium and beamformer.
Every scanner assumes 1540 metres per second
Delay-and-sum (DAS) receive beamforming reconstructs each pixel by delaying echoes for the round trip between transducer and tissue, weighting them, and summing across the array. Estimating that round trip requires the speed of sound in the medium, and conventional DAS settles the question by fiat: a spatially constant 1540 m/s everywhere, regardless of what the sound actually crossed.
Human tissue is heterogeneous, with speed-of-sound variations of up to 10%. The mismatch produces delay errors that accumulate with depth, degrading resolution, contrast, and the geometric accuracy of the image. A superficial fat layer, common in liver and abdominal imaging, is the classic offender: sound crosses it at roughly 1400 m/s, not 1540, and everything below it lands in the wrong place.
Refraction-corrected delay estimation exists in the literature, but earlier work either confined the correction to specific regions such as the skull, or to specific transmit schemes such as synthetic aperture, and demonstrated it only to about 5 cm of depth. To the best of the authors’ knowledge, this is the first work to consider the effect of speed-of-sound on image quality for deeper imaging, validated here to roughly 11 cm.
March the wavefront, not the straight line
Instead of dividing a Euclidean distance by 1540, each delay is computed as the travel time of a wavefront propagating through the actual speed map, obtained by solving the eikonal equation with the fast marching algorithm.
Redrawn from Fig. 2 of the paper. Each run inputs the speed-of-sound map with a source and destination; the correction works with ordinary focused transmissions.
Four media, one fat layer, three tilts
Four k-Wave simulations share the same three cysts and ten point targets. M1 has no fat layer. M2 adds a straight one; M3 and M4 incline it by 10 and 25 degrees, adding a lateral gradient to the delay error.
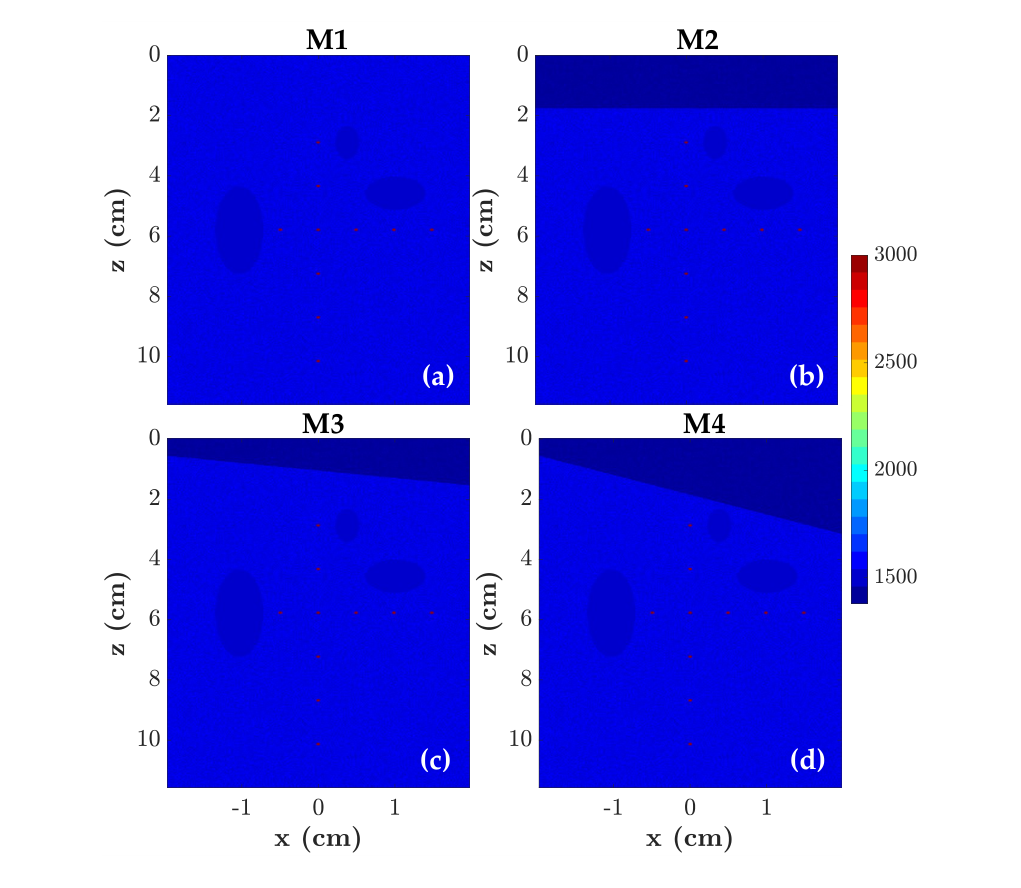
Fig. 3 of the paper. Speed-of-sound maps of the four media modeled with the k-Wave ultrasound toolbox: (a) M1, no fat layer; (b) M2, straight fat layer; (c) M3, inclined at 10°; (d) M4, inclined at 25°.
What a speed map buys back
With conventional delays, cysts and pins drift as the fat layer tilts, and CY1 visibly shears. With fast marching delays computed on the (smoothed, median-filtered) ground-truth speed maps, the shifts and the shear are corrected.
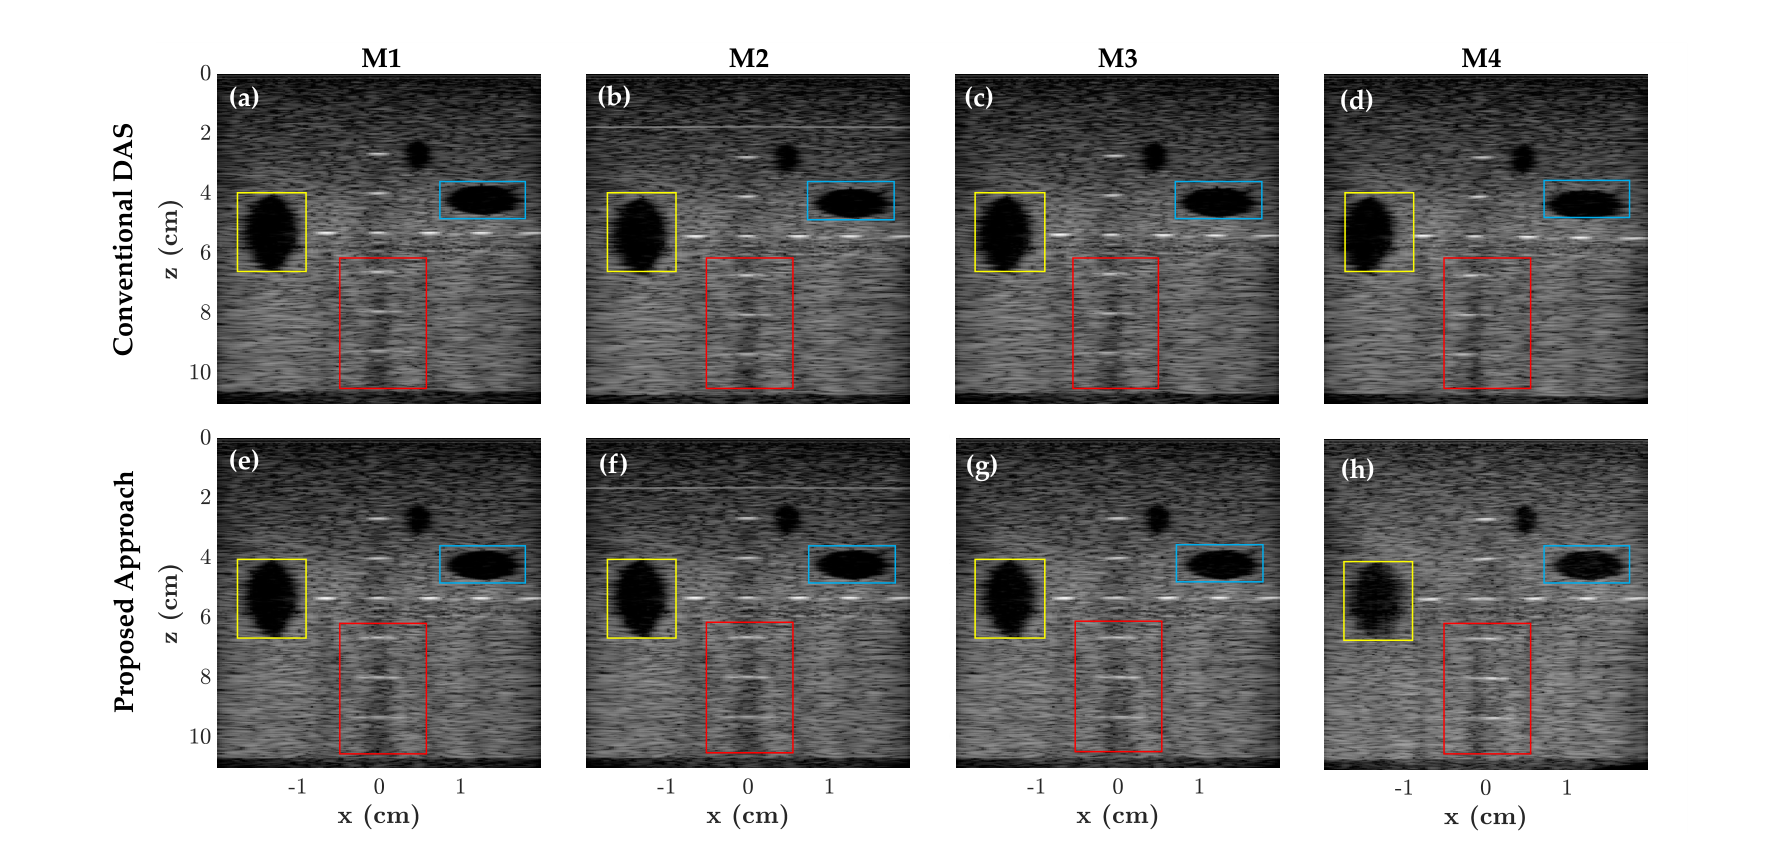
Fig. 4 of the paper. Beamformed images at 60 dB dynamic range. Top row: conventional DAS for (a) M1 to (d) M4; the yellow box marks the shearing CY1, the blue box the shifting CY3, the red box the shifting pins. Bottom row (e)–(h): the proposed fast marching DAS corrects the distortions.
| Medium | Mean GDS · conventional | Mean GDS · fast marching | gCNR · conventional | gCNR · fast marching |
|---|---|---|---|---|
| M1 · no fat | 0.7 | 0.7 | 0.79 | 0.76 |
| M2 · straight | 0.1 | 0.7 | 0.77 | 0.77 |
| M3 · 10° | 0.2 | 0.9 | 0.75 | 0.75 |
| M4 · 25° | 0 | 0.6 | 0.67 | 0.75 |
GDS scores a point target 1 if it sits within one wavelength of its true position, 0 otherwise, averaged over the ten targets. gCNR measures the overlap of intensity distributions inside and outside the cyst against its true location.
What this page does not claim
The correction shown here uses the ground-truth speed-of-sound maps from the simulator, smoothed and median filtered before feeding the fast marching solver. In a clinic no such map is handed to you; pairing the method with an approximate speed-of-sound estimation technique is the stated path forward, and the clinical case, overcoming fat-induced aberrations in liver and abdominal imaging, depends on it.
The study is simulation only, with no human or animal subjects. On an Intel Core i7-8700 workstation the delay estimation takes about 90 seconds per image. Experimental validation, approximate speed-of-sound maps, and acceleration of the fast marching algorithm are named as future work in the paper.