Ultrasound Localization Microscopy
Breaking the diffraction barrier in vascular imaging by localizing individual microbubbles across thousands of frames, reconstructing microvasculature at resolutions ten times finer than conventional ultrasound.
Beyond the Diffraction Limit
Conventional ultrasound imaging is bounded by the diffraction limit, making microvascular visualization inherently challenging. The resolution of standard B-mode imaging is on the order of the transmitted wavelength, meaning vessels smaller than a few hundred micrometres remain invisible.
Contrast-enhanced ultrasound (CEUS) improves vascular contrast by injecting gas-filled microbubbles into the bloodstream, but resolution remains diffraction-limited. ULM overcomes this trade-off by combining microbubble contrast agents with high frame rate imaging, localizing individual bubbles across thousands of frames to build a super-resolution vascular map.
This has the potential to transform the diagnosis of stroke, arteriosclerosis, cancer, and other microvascular pathologies by providing structural and functional maps of the microvasculature at resolutions of tens of micrometres.
- ResolutionSub-wavelength, typically one-tenth of the transmitted wavelength
- ContrastIntravenously injected gas-filled microbubbles (1-10 µm)
- Frame rateUltrafast plane wave compounding at 500+ Hz
- ApplicationsStroke, arteriosclerosis, cancer, organ perfusion
From RF Data to Velocity Maps
The ULM pipeline begins with ultrafast acquisition using non-steered plane wave transmission, producing RF channel data at hundreds of frames per second. The received echoes are then beamformed to reconstruct B-mode images.
Microbubble positions are estimated from each beamformed frame using one of several localization algorithms. Frame-to-frame tracking links individual bubbles across time, and the accumulated trajectories are rendered into super-resolution localization maps and velocity maps.
This work uses the Localization and Tracking Toolbox for Ultrasound Localization Microscopy (LOTUS), an open platform that provides four localization algorithms and standardized tracking and mapping routines.
- AcquisitionNon-steered plane wave, 128-element linear array
- FrequencyIn-silico: 15.625 MHz, 500 Hz frame rate; In-vitro: 7.6 MHz, 2000 Hz
- ProcessingSVD clutter filter, beamforming, localization, tracking, mapping
- ToolboxLOTUS: open-source benchmarking platform for ULM
F-DMAS: Enhancing Resolution at the Signal Level
Most reported ULM research uses Delay and Sum (DAS) beamforming despite its limited contrast and resolution. This work is the first to apply Filtered Delay Multiply and Sum (F-DMAS) beamforming to ULM, achieving improved lateral resolution and contrast without the parameter tuning overhead of adaptive beamformers.
Delay and Sum (DAS)
The standard beamforming technique that delays received signals by their propagation time and sums across all channels with apodization weights. Computationally simple but limited in contrast and resolution.
Filtered Delay Multiply and Sum (F-DMAS)
Multiplies delay-compensated signals from every channel pair before summation, creating a “synthetic” receive aperture widening. A bandpass filter centered at 2fc extracts the coherent component, improving both contrast and lateral resolution.
Pinpointing Every Microbubble
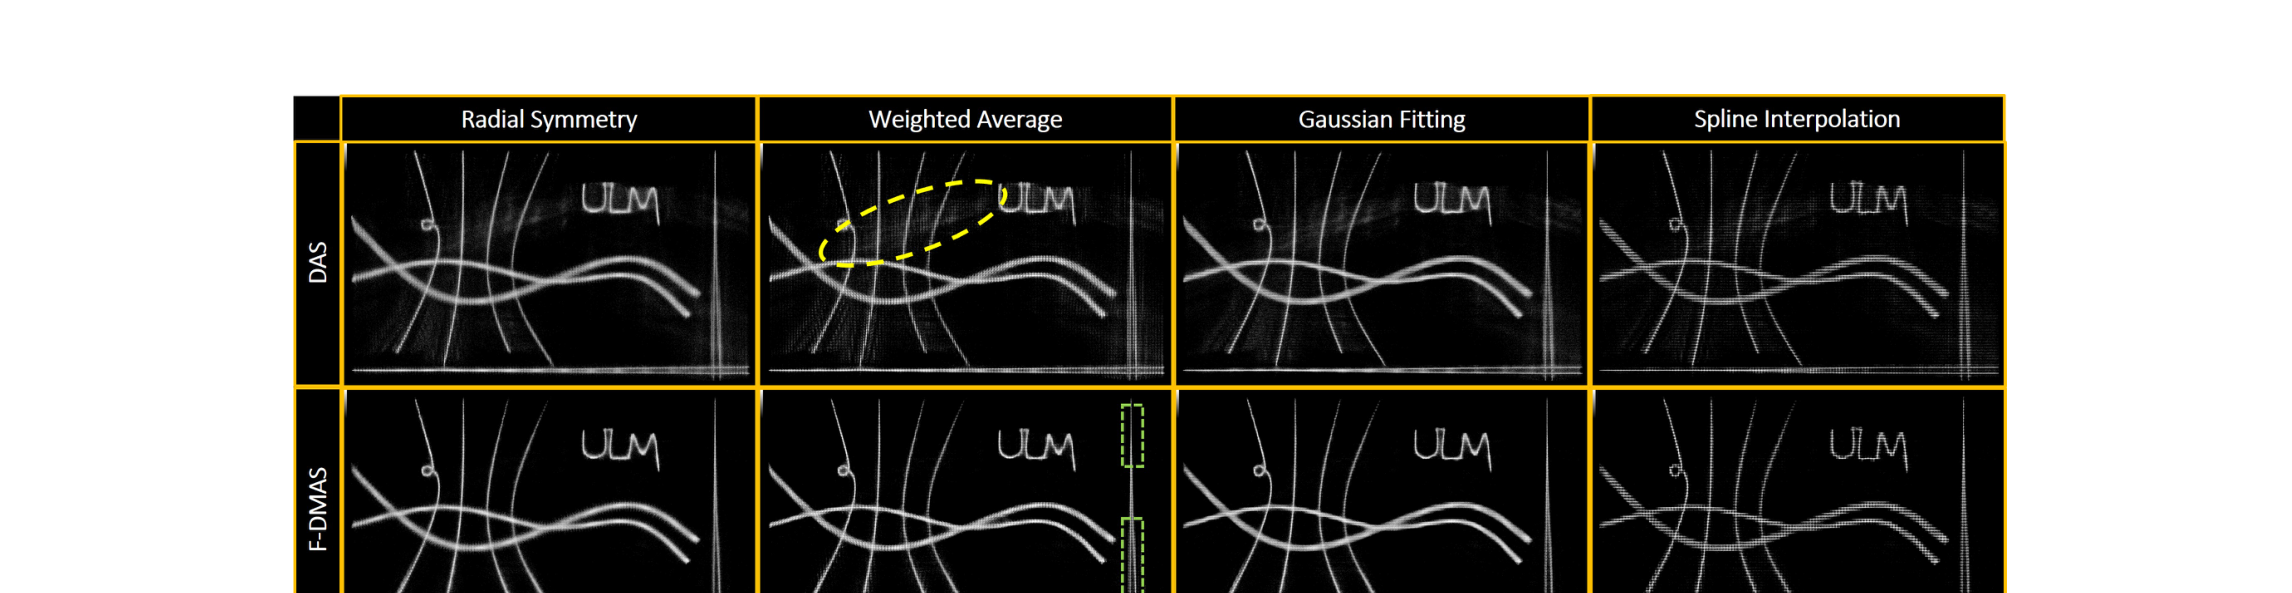
Four localization algorithms were evaluated on both DAS and F-DMAS beamformed images, each operating on cropped regions of λ × λ centered on the highest-intensity pixel, with sub-wavelength output resolution of 0.1λ × 0.1λ.
Radial Symmetry
Exploits the shape of the point spread function (PSF) and estimates the best-fit radial symmetry center. One of the most reliable techniques for sub-wavelength microbubble localization.
Weighted Average
Estimates the microbubble centroid as a weighted average of intensity over axial and lateral directions. The most computationally efficient of the four methods evaluated.
Gaussian Fitting
Fits a Gaussian kernel to the microbubble intensity profile and estimates the peak position. Provides good accuracy but at higher computational cost than simpler methods.
Spline Interpolation
Interpolates the image to 0.1λ resolution using a spline method, then identifies the peak. Consistently achieves the best results across both beamformers, closest to the ground truth.
Measuring What Matters in ULM
Conventional image quality metrics like contrast-to-noise ratio and full-width half maximum (FWHM) require targets such as cysts or point scatterers for evaluation. In ULM, where the microvasculature is the structure of interest, such targets are absent.
This work introduces two novel metrics designed specifically for ULM quality assessment:
Local contrast score computes a local standard deviation image using a moving kernel of 0.2λ × 0.2λ, then reports the root-mean-square (RMS) value. Higher scores indicate better vessel-to-background separation in the localization map.
Lateral spread score extends the FWHM concept to measure the mean width of a vessel’s main lobe at half maximum from the normalized intensity profile. Lower values indicate finer lateral resolution.
| Beamformer | Localization | Contrast (mean) | Std. Dev. | Lateral Spread |
|---|---|---|---|---|
| DAS | Radial Symmetry | 0.854 | 0.258 | 0.462λ |
| DAS | Weighted Average | 0.868 | 0.243 | 0.365λ |
| DAS | Gaussian Fitting | 0.869 | 0.244 | 0.325λ |
| DAS | Spline Interpolation | 0.905 | 0.213 | 0.263λ |
| F-DMAS | Radial Symmetry | 0.901 | 0.237 | 0.346λ |
| F-DMAS | Weighted Average | 0.919 | 0.217 | 0.330λ |
| F-DMAS | Gaussian Fitting | 0.919 | 0.219 | 0.319λ |
| F-DMAS | Spline Interpolation | 0.932 | 0.199 | 0.257λ |
| Ground Truth | – | 0.952 | 0.173 | 0.238λ |
In-silico and In-vitro Validation
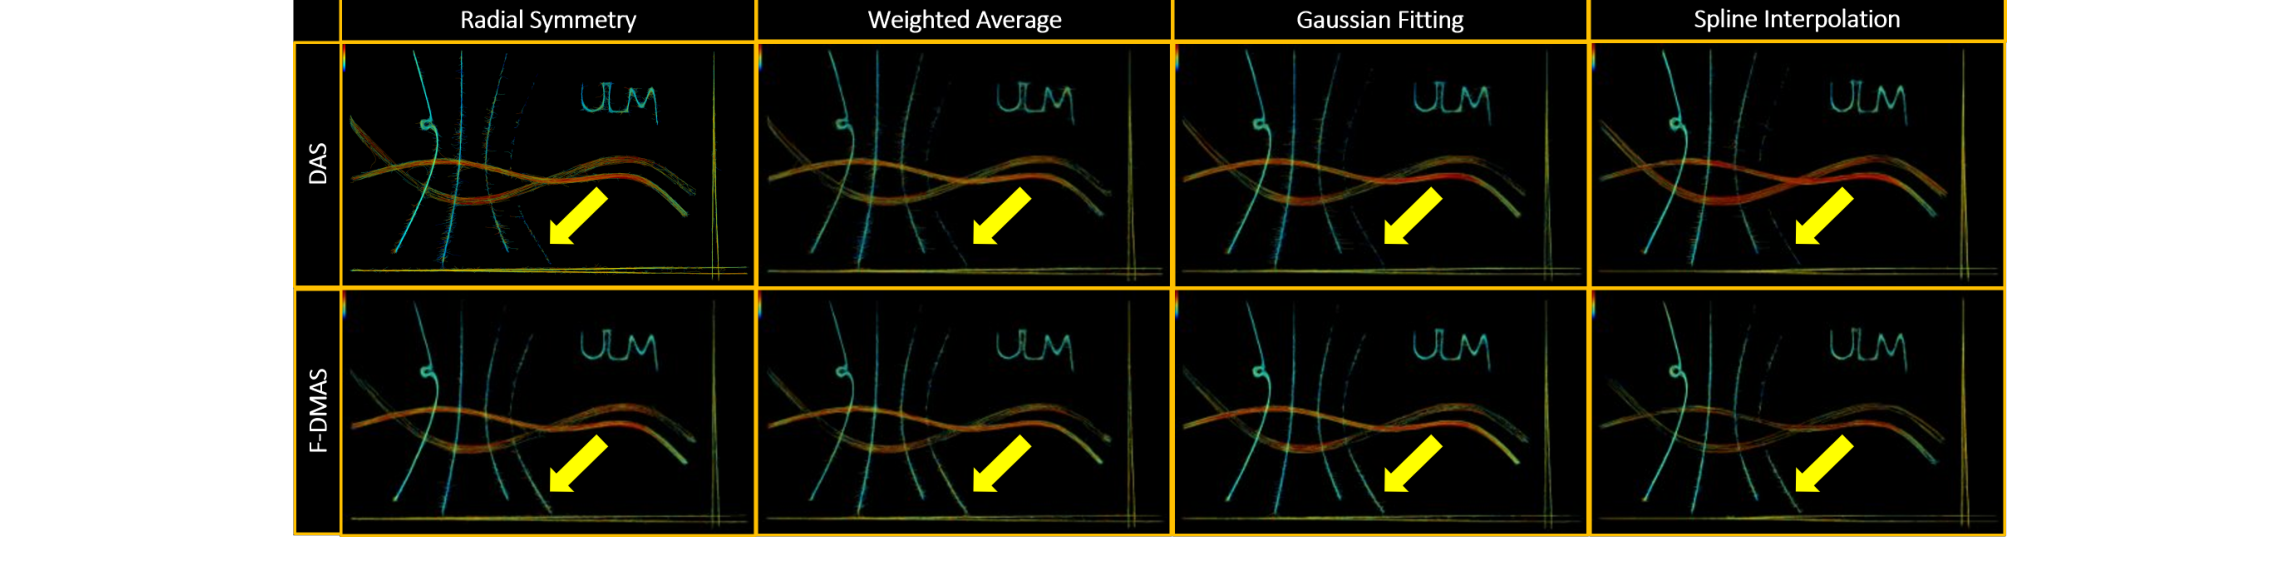
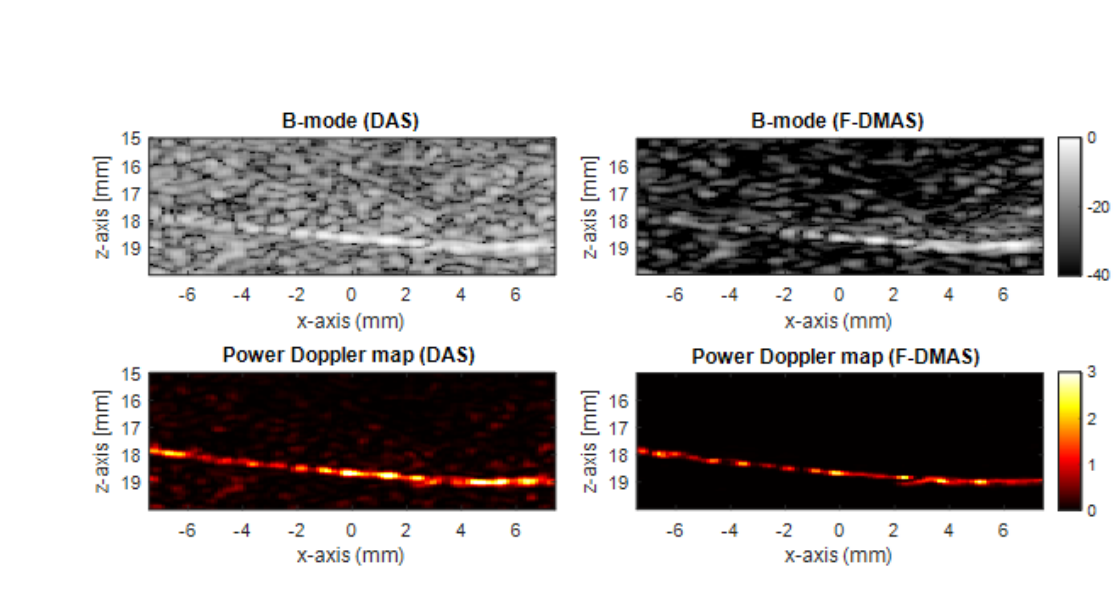
The F-DMAS beamformer was validated on both simulated (PALA open dataset, 11-tube phantom) and experimental data (poly-vinyl-alcohol microvascular phantom with 110 µm vessels), confirming improved performance across localization maps, velocity maps, B-mode images, and power Doppler maps.
In-silico Findings
Localization maps from F-DMAS demonstrated better lateral resolution than DAS, particularly for the vertical canals in the simulated phantom. Side lobe artifacts visible in DAS-based maps were reduced with F-DMAS, and overall microvasculature contrast was enhanced.
Normalized velocity maps confirmed that F-DMAS preserves flow information. The thinnest vertical channel, which was completely missing with DAS beamforming, was recovered with F-DMAS irrespective of the localization technique.
- DatasetPALA in-silico angiography, 128-element array, 0.11 mm pitch
- Centre Freq15.625 MHz, sampled at 100 MHz
- Phantom11 tubes of varying geometry and complexity
- ImprovementReduced side lobes, enhanced contrast, recovered missing vessels
In-vitro Validation
Experimental validation on a poly-vinyl-alcohol (PVA) based microvascular flow phantom with vessels of 110 µm diameter confirmed the simulation results. The phantom was prepared using a Verasonics Vantage 128 research ultrasound system with a 128-element linear array (L11-5v).
Better clutter suppression and improved resolution were observed with F-DMAS in both the B-mode images and power Doppler maps. These improvements are attributed to the “synthetic” receive aperture widening and improved coherence from the cross-multiplication step in F-DMAS.
- SystemVerasonics Vantage 128, L11-5v array
- Centre Freq7.6 MHz, 1.5λ pitch, sampled at 31.25 MHz
- Frame Rate2000 Hz plane wave transmission
- Contrast3% starch-based blood mimicking fluid (53-44% v/v)
Research Output
Published work on ultrasound localization microscopy from our group.